How to use Sales reports in effectmanager
This guide shows you how to use POS Sales reports in the effectmanager Report module.
This guide is only of relevance if you have the online POS reports module in effectmanager.
The Sales reports in our online POS reporting module offers data in three different reports. Below we will go through the different reports.
Sales per Day
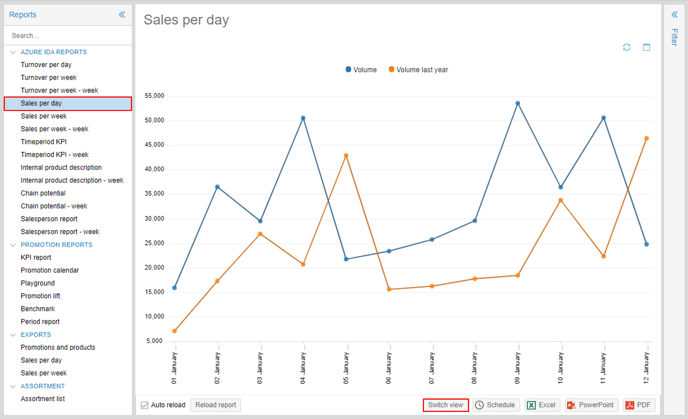
This POS report will provide you with a graph on a daily level based on your filtering selection compared to the same period last year.
If you need a guide that show you how to use filters in effectmanager please see our guide How to use filters in effectmanager
In the example below, I have selected Bilka from the 01 of January to the 12 of January 2020.
In the report, I get both a graph and a table - the Graph is always preselected, and you will need to press Switch view to see the sales table.
All Sales reports can be exported to Excel, PowerPoint, and PDF by pressing the icons at the bottom of the report. Exports to Excel will only include the Sales Table.
You also have the option to Schedule Reports for send-out to yourself, your Sales reps or others.
If you need a guide that show you how to schedule reports in effectmanager, please see our guide How to schedule a task/report in effectmanager

Sales per Week
This POS report will provide you with a graph on a weekly level, using the day hierarchy, based on your filtering selection compared to the same period last year.
If you need a guide that show you how to use filters in effectmanager please see our guide How to use filters in effectmanager
Using the Sales per Week report with a daily period hierarchy, you will be able to select a period that stretches beyond the defined weeks.
As you can see from my example below, I have selected Bilka from the 01st of January to the 19th of January 2020 in my filter. This is from Wednesday week 01 to Sunday week 03.
In the report, I will get a graph with data on week 01 from Wednesday-Sunday, week 02 and 03 with data from Monday-Sunday.
🔴OBS! If you need to compare sales on a weekly level with sales from the same week last year, you must use the Week-Week report or IDA Dynamic filters. This report will compare the exact dates from your period filter with the exact dates from last year, as weeks shift in dates you will not be able to compare weeks this year with weeks last year.
NB! Using this report, you must be aware of your selected filter, to get the correct data for the weeks. Try comparing Sales Week with the Sales Week - Week report to see the difference when not filtering on full weeks.

In the report, I get both a graph and a table - the Graph is always preselected and you will need to press Switch view to see the sales table.
All Sales reports can be exported to Excel, PowerPoint, and PDF by pressing the icons at the bottom of the report. Exports to Excel will only include the Sales Table.
You also have the option to Schedule Reports for send-out to yourself, your Sales reps or others.
If you need a guide that show you how to schedule reports in effectmanager, please see our guide How to schedule a task/report in effectmanager
Sales per Week - Week
This POS report will provide you with a graph on a weekly level, using the weekly hierarchy, based on your filtering selection compared to the same period last year.
If you need a guide that show you how to use filters in effectmanager please see our guide How to use filters in effectmanager
Using the Sales per Week - Week report with a weekly period hierarchy, your selected period will always be shown in full weeks.
As you can see from my example below, I have selected Bilka from the 01st of January to the 19th of January 2020 in my filter.
In the report, I will get a graph with data from Monday the 30th of December to Sunday the 19th of January, as this report will always contain full weeks.

In the report, I get both a graph and a table - the Graph is always preselected and you will need to press Switch view to see the sales table.
All POS reports can be exported to Excel, PowerPoint, and PDF by pressing the icons at the bottom of the report. Exports to Excel will only include the Sales Table.
You also have the option to Schedule Reports for send-out to yourself, your Sales reps or others.
If you need a guide that show you how to schedule reports in effectmanager, please see our guide How to schedule a task/report in effectmanager